 Juhee Oh
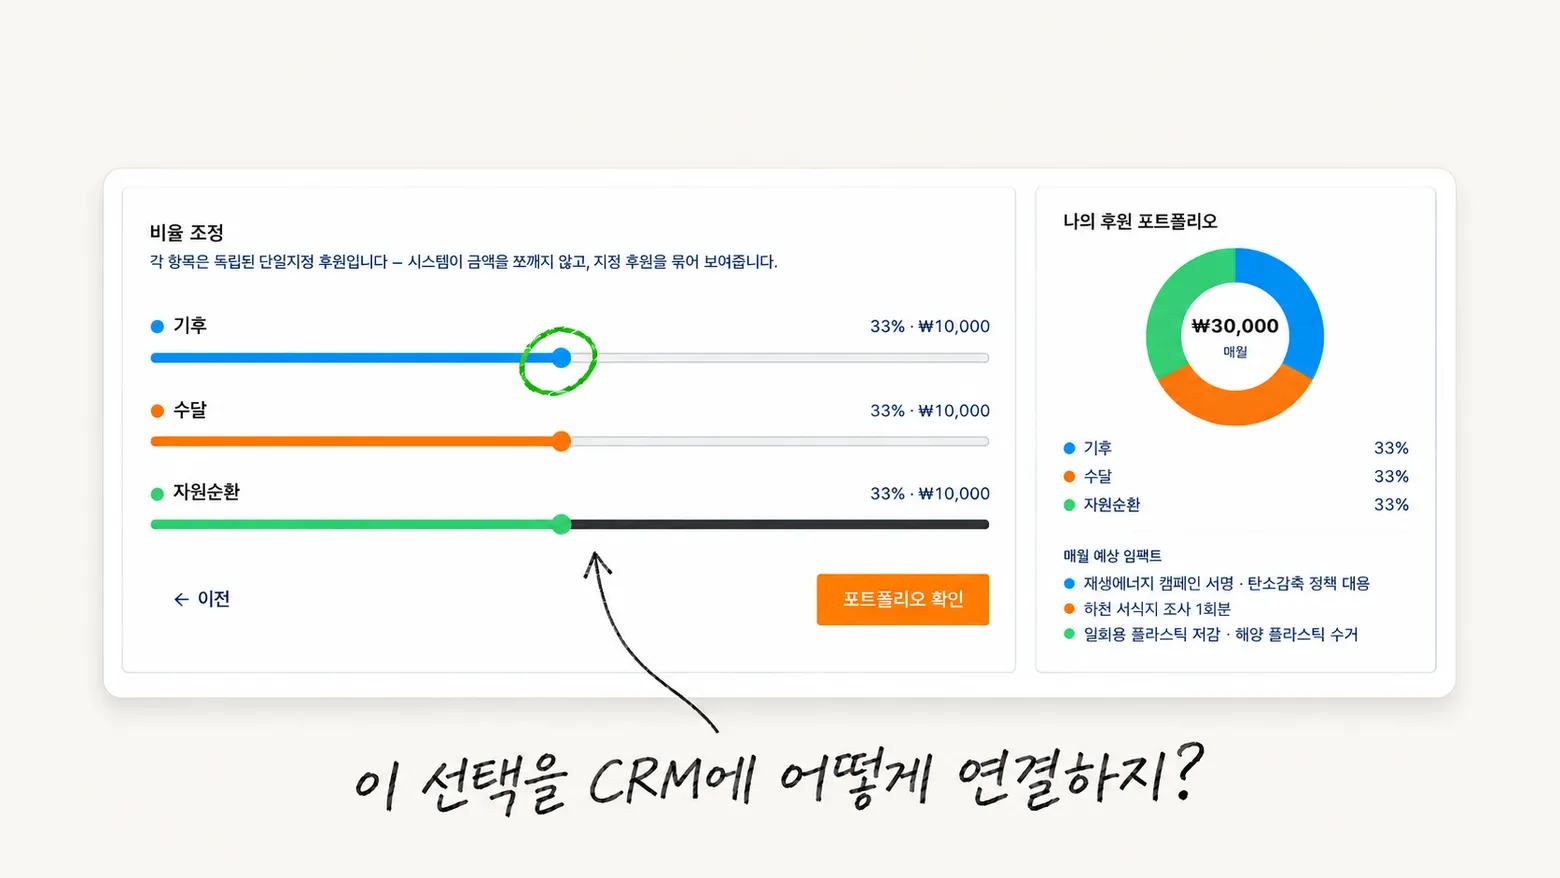
Choose a donation amount, select the causes you care about, and adjust their proportions with sliders. The donut chart updates alongside them. On screen, the donation experience I had imagined was working.
But when I thought about connecting that interface to a real service, another question came up: when someone moves a slider, what needs to change in the existing donation management system?
That question stayed with me after proposing a donation platform for WWF. Over roughly two weeks, I handled research, information architecture, and responsive UX/UI design. While preparing the proposal, I also built an interactive web prototype. The project ended at the proposal stage; it did not become a service connected to real payments and a CRM.
This post looks back at the experience I wanted to offer donors and what I reconsidered when connecting it to existing systems.
Giving Donors a Reason to Return
When I first explored the site, I was curious about what happened after making a donation, as well as how to start one.
There were paths from conservation stories to campaign donation pages. But while browsing the public pages, I had trouble finding a flow that brought together my chosen causes, donation amounts, and related activities. My research did not cover features behind sign-in, so this alone could not establish whether those management features already existed.
I wanted to propose something donors could do when they came back. Beyond knowing that they were still donating each month, they could see the causes they had chosen and read about related work. If their interests changed, they could revisit their donation choices, too.
That led to the idea of a personal donation portfolio: choose climate action, circularity, biodiversity, or particular animals, then see those donations in one place.
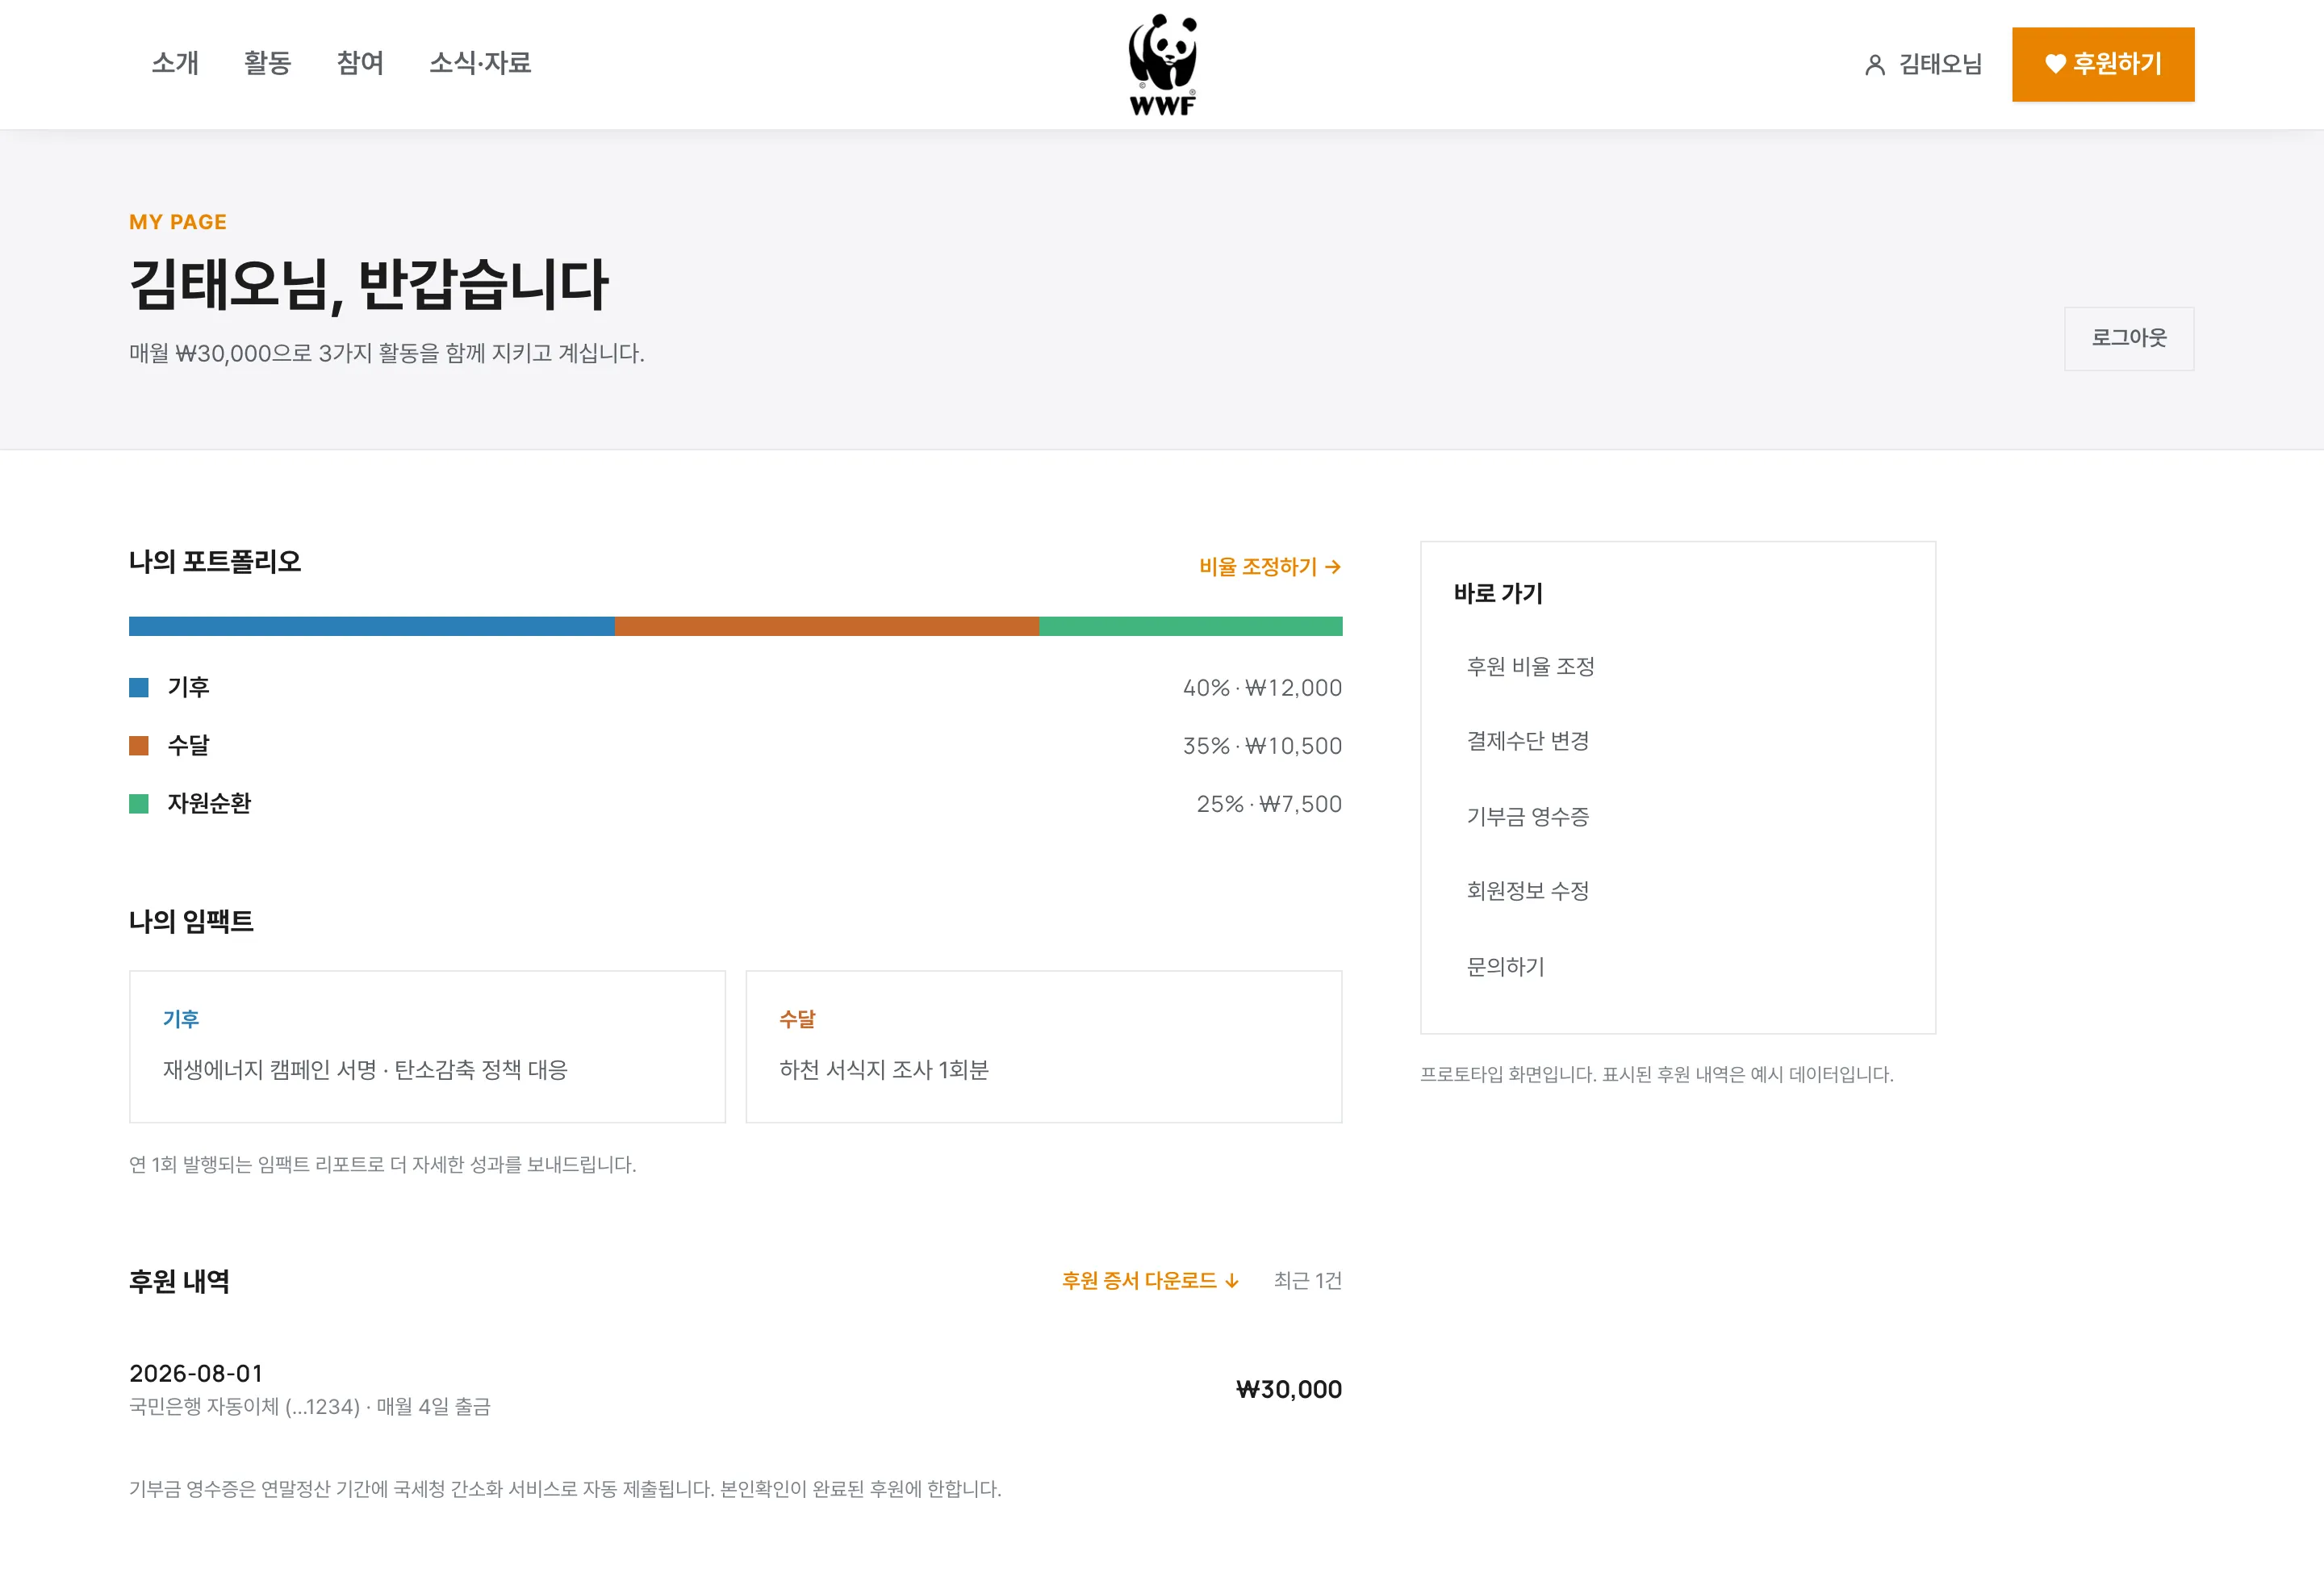
This account dashboard proposes an experience for returning donors. The donation records and activity information are sample data in a Korean-language prototype.
Starting with One Amount to Divide
The initial idea was to let donors adjust how a monthly amount was allocated across causes. Someone donating ₩30,000 a month, for example, could choose how much of that went toward climate action and animal protection.
It was easy to explain on screen: a total amount, selected causes, and a share for each one. Moving a slider could update both the amounts and the chart.
The prototype broke this into four steps: amount, causes, allocation, and confirmation. The final step showed how much would go to each cause. I also connected flows for reviewing and adjusting the portfolio from the account dashboard, along with a certificate and sharing screen featuring the selected causes.
Making it interactive helped me examine the transitions between steps and how the interface responded. What I had checked, however, was interface behavior using sample data. Whether those choices could be registered as real donations and remain consistent over time still needed separate verification.
What Actually Changes When a Proportion Changes?
Encountering difficulties with the existing CRM integration made me reconsider these choices from an operational perspective. The CRM manages donor information and donation records, among other things. Each cause and amount shown in the new interface needed to correspond to a record there.
Adding an “otters” option to a screen is straightforward. Whether otter conservation could actually be registered as a separate designated donation needed confirmation. I also could not assume that categories used to explain conservation work matched the program units used to manage funds.
The same applied to “changing an allocation.” The steps a donor would need to take depended on whether this meant updating an existing donation amount or ending some donations and starting new ones. The guidance would also depend on when a change took effect.
I did not verify which changes a specific API could or could not support at the time. So I cannot attribute the integration difficulty to a single technical cause. What became clear was that I needed to check whether an action I had presented as one step on screen could also be handled as one action in the underlying system.
I also noted in the proposal that the final donation categories would need to be agreed with the organization’s accounting and program teams. Naming options clearly on screen and defining what people could actually donate to needed to happen together.
Keeping Donations Separate and Showing Them Together
To reduce the integration burden, I reframed each item as an independent designated donation, with the interface bringing them together.
For example, ₩10,000 for climate action, ₩10,000 for otter conservation, and ₩10,000 for circularity would each be treated as a separate donation. The portfolio would provide one place to review and manage them. The total and donut chart would show how much each donation contributed to the overall mix.
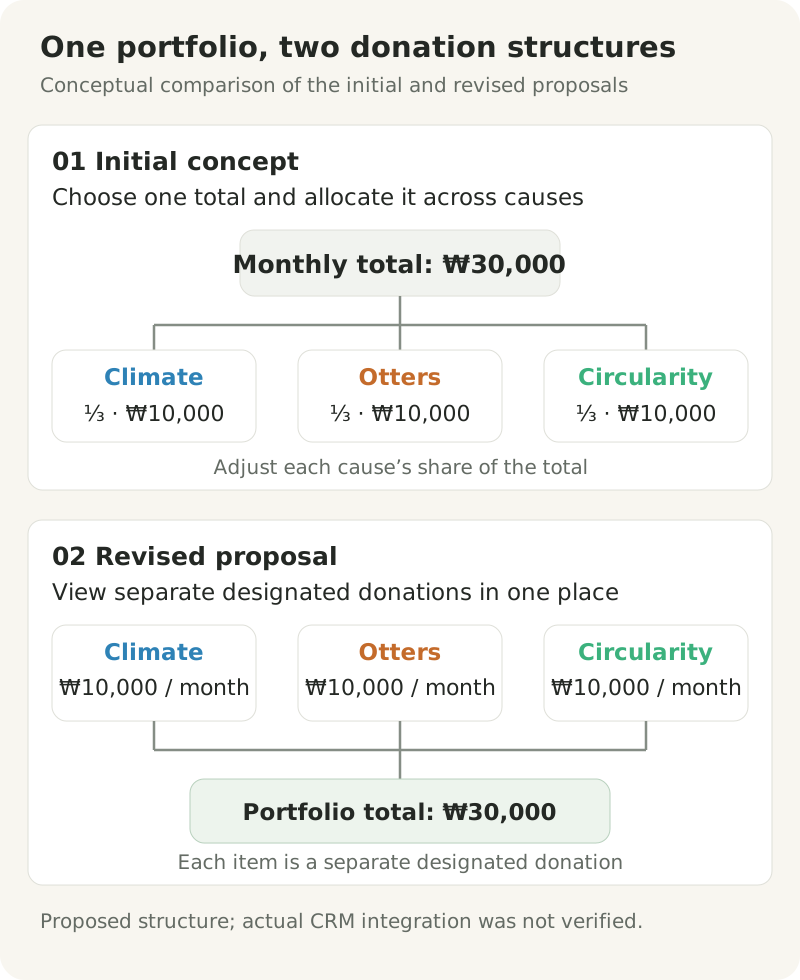
This diagram explains the initial concept and revised proposal. It does not represent a verified CRM data model or a tested integration.
This framing also made the chart’s meaning more precise. The proportions represented the amounts the donor had chosen to give. They did not indicate actual program spending or impact. Showing related activities alongside donations would still require separate evidence before claiming that a particular donation funded a particular activity.
Grouping independent donations on screen did not resolve the integration by itself. I still needed to check whether someone could apply for several donations at once, change only some amounts, and retrieve the resulting records. This remained a proposed structure rather than an approach validated in live operations.
Questions I Would Ask Earlier Next Time
After this experience, I wanted to understand earlier how a choice would actually be processed before offering it to users.
If I took on a similar project again, I would start with questions like these:
- What units are available donation targets registered under?
- For an existing donation, can the cause, the amount, or both be changed?
- Does a change apply to the current payment or the next one?
- How will a donation submitted through the new interface connect to an existing donor record?
- What activity information can be linked to donation records and shown to donors?
The answers would shape the interface. A change that does not take effect immediately needs an effective date. If an existing donation cannot be edited directly, the donor may need guidance through another application process. If only certain adjustments are possible, even a control as seemingly flexible as a slider needs reconsideration.
Understanding those conditions would help me design more accurately around what users can expect from the interface.
What Stayed with Me After Building the Prototype
I did not validate the proposed flow against real donor payments or changes to donation records. I also have no results showing an improvement in donation conversion or return visits.
Still, building and interacting with the screens was valuable. It made the proposed experience tangible and helped me ask whether the steps that felt natural in the interface could also connect to existing operations.
When I look at the donation builder now, I think first about the questions behind the chart and sliders. Will the selected causes appear in actual donation records? Will donors see the same portfolio when they return? When will a requested change take effect?
Next time, I want to work through those questions while designing the screens, with a clearer understanding of what each button sets in motion behind the scenes.